

Above Ground Biomass and Tree Species Diversity in Anap Sustainable Development Unit, with the Focus on the High Conservation Value Forest (HCVF)[Hiromitsu Samejima, Malcom Demies, Miyako Koizumi]
Above Ground Biomass and Tree
Species Diversity in Anap Sustainable
Development Unit, with the Focus
on the High Conservation Value
Forest (HCVF)
Hiromitsu Samejima(Center for Southeast Asian Studies,
Kyoto University)
Malcom Demies(Sarawak Forestry Cooperation)
Miyako Koizumi(Graduate School of Agriculture, Kyoto University)
Introduction
Maintenance of biomass or carbon stock and biodiversity are among the targets of sustainable forest management (SFM) and establishing a high conservation value forest (HCVF) is one of the measures of SFM to achieve these targets. However, the performance of HCVF management has not been well studied. Inside the Anap Sustainable Development Unit (ASDU), Sarawak, Malaysia, four HCVFs and three water catchment areas (WCs) have been established. WCs in ASDU were originally listed as a part of HCVFs in the Forest Management Plan for Anap-Muput Year 2006–2025, and accordingly can be considered part of HCVFs in ASDU. In ASDU, we established 70 vegetation plots to evaluate the aboveground biomass (AGB) and tree species diversity in the management area. Using these data, we evaluated the contribution of HCVFs in sustaining the high biomass and rich biodiversity of ASDU. Materials and Methods
Study site
ASDU is located in Tatau District, Bintulu Division, Sarawak, Malaysia. It is managed by a private company, Zedtee Sdn Bhd. ASDU covers an area of 106,820 ha, and its forests can be classified into three types: lowland/hill mixed dipterocarp forest (MDF), Kerangas forest, and riparian forest. MDF is the major forest type in lowland Borneo and ASDU. Kerangas forest is a heath forest on sandy nutrient-poor soil, distributed in the southeast part of ASDU. Riparian forest is a type of MDF distributed along rivers but generally more degraded and with lower densities of large trees than normal MDF on the slopes and ridges, probably because the riparian area is more vulnerable to logging disturbance. The management system of ASDU is divided into three parts: Anap-Muput Forest Management Unit (FMU: T/4317), which forms the main part; an area with License for Planted Forest (LPF/0039) in the northern part; and Anap-Belawit state land in the south (Fig. 1). The Anap- Muput FMU is divided into coupes and managed in a 25- year cutting cycle for sustainable timber production of indigenous tree species such as meranti (Shorea spp.) and kapur (Dryobalanops spp.). Logging activity in ASDU started in 1977, all the coupes have been harvested at least once, and coupes 1–12 have been harvested again in the last 12 years. LPF is allocated for intensive planting of fast-growing species, and the original vegetation has been repeatedly harvested, but most of the area has not been planted to date.
 In ASDU, H. Samejima and J. Hon established eight
plots to conduct camera-trapping surveys for grounddwelling,
middle, and large-sized mammals from 2011
to 2013 (Samejima & Hon 2014). One plot is a circle with
1-km diameter and eight cameras are set inside at randomly
selected points. Hon also established a 2-km line
transect along each of the three rivers where natural salt
licks were present and conducted a camera trap survey
from 2010 to 2011 (Hon 2011; 2013; Hon & Shibata 2013).
In ASDU, Zedtee established four HCVFs, HCVF1–4.
Demies and Sang (2008) established six quadrats in
HCVF1, three in HCVF2, nine in HCVF3, and five in
HCVF4 in 2008. Each quadrat was of 50 × 50 m. They
recorded all trees belonging to three genera of Dipterocarpaceae,
Dipterocarpus, Dryobalanops, and Shorea with
diameter at breast height (DBH) of ≥10 cm.
Vegetation plots
From 2011 to 2013, H. Samejima and M. Demies established
61 circle plots with radius 20 m (0.126 ha) and M.
Koizumi established 9 circle plots with radius 15 m (0.071
ha) distributed in 19 areas (Table 1, Fig. 1, Koizumi
2012). The distances between the neighboring plots within
an area were approximately 100 m. A total of 18 plots
were positioned in three HCVFs and two WCs. HCVF3
and WC_Ayam are covered by primary forests, and theother two HCVFs and one WC are covered by old-growth
forest that was harvested during the 1980’s. Four plots in
HCVF1 and two plots in HCVF3 overlap the quadrates
established by Demies and Sang (2008). 11 areas were
set up the eight plots and along the three transects for
the camera trap study. The other four areas were selected
to include the other vegetation types. C06b is a swampy
area where trees were harvested 7 years ago, and C06c
is mostly primary forest remaining along a steep ridge in
coupe 6.
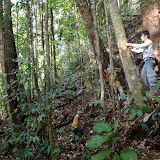
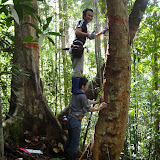
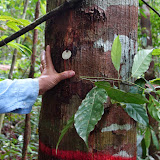
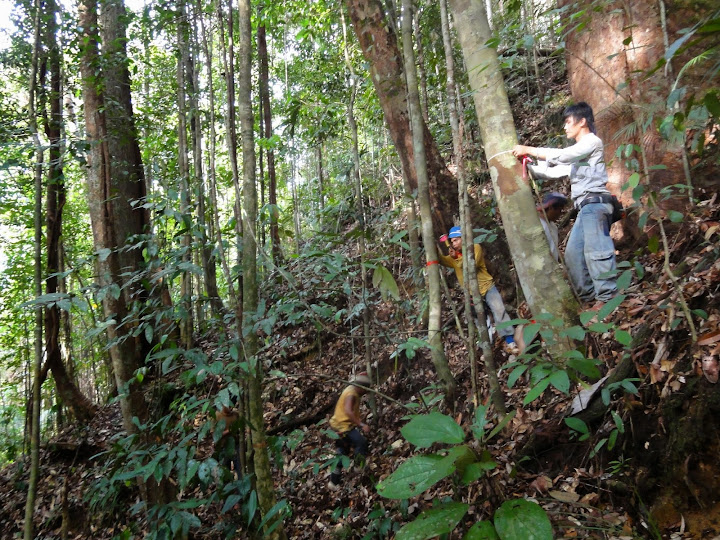
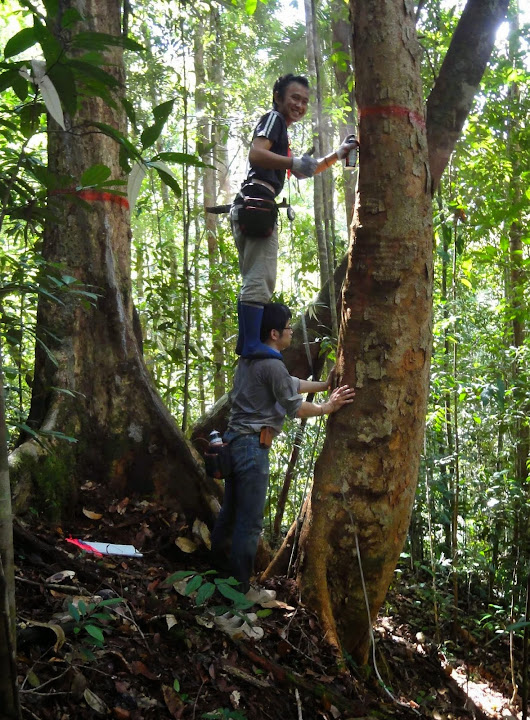
Inside each plot, we measured DBH and heights of all
trees with DBH (at 130 cm above ground) of ≥10 cm. We
painted a red line at the height where DBH was measured
(Figs. 2, 3) and attached a metal number plate (Fig. 4) for
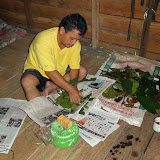
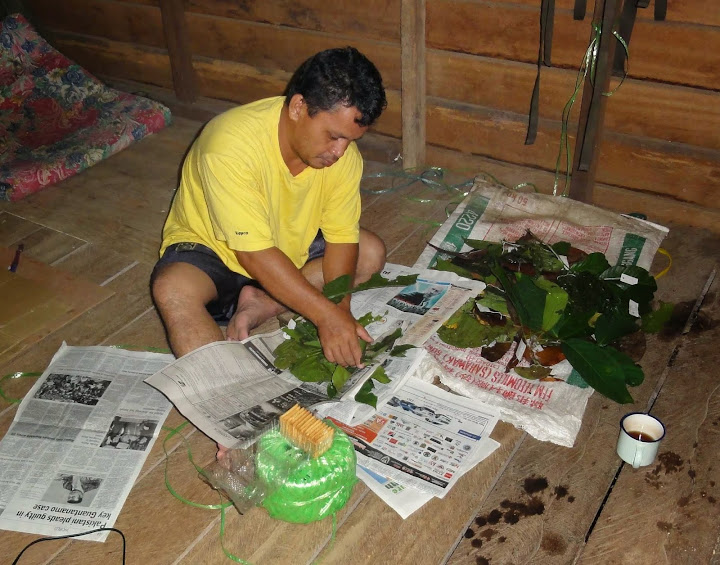
future re-census. All trees were identified by staffs of
Botanical Research Center, Sarawak Forestry Corporation
and Koizumi, referring to the herbarium of Sarawak
Forest Research Center, Kuching (Fig. 5). The classification
followed the Angiosperm Phylogeny Group III system.
There are three formulas for estimating AGB of tropical
moist forest (FAO 1997, Chave et al. 2005):
1) AGB = exp ( -2.977 + ln (ρD 2H ) )
2) AGB = ρ × exp ( -1.499 + 2.148 ln (D ) + 0.207( ln (D ) )2 – 0.0281( ln (D ) )3 )
3) AGB = exp ( -2.134 + 2.53 ln (D ) )
ρ : Wood specific gravity D : Diameter at breast height H : Total tree height
Following these formulas, we obtained three estimates,
AGB1, AGB2, and AGB3, of the AGBs of all
trees. Wood specific gravity data were based on Lemmens
et al. (1995), Oey (1951), Soerianegara and Lemmens
(1993), and Sosef et al. (1998) following Imai et
al. (2012). In case wood specific gravity of a genus was
unknown, we used AGB3 as a substitute for AGB1 and
AGB2 for the tree. As Koizumi did not measure the
tree heights, we calculated only AGB2 and AGB3 for
her data.
Results
In ASDU, H. Samejima and J. Hon established eight
plots to conduct camera-trapping surveys for grounddwelling,
middle, and large-sized mammals from 2011
to 2013 (Samejima & Hon 2014). One plot is a circle with
1-km diameter and eight cameras are set inside at randomly
selected points. Hon also established a 2-km line
transect along each of the three rivers where natural salt
licks were present and conducted a camera trap survey
from 2010 to 2011 (Hon 2011; 2013; Hon & Shibata 2013).
In ASDU, Zedtee established four HCVFs, HCVF1–4.
Demies and Sang (2008) established six quadrats in
HCVF1, three in HCVF2, nine in HCVF3, and five in
HCVF4 in 2008. Each quadrat was of 50 × 50 m. They
recorded all trees belonging to three genera of Dipterocarpaceae,
Dipterocarpus, Dryobalanops, and Shorea with
diameter at breast height (DBH) of ≥10 cm.
Vegetation plots
From 2011 to 2013, H. Samejima and M. Demies established
61 circle plots with radius 20 m (0.126 ha) and M.
Koizumi established 9 circle plots with radius 15 m (0.071
ha) distributed in 19 areas (Table 1, Fig. 1, Koizumi
2012). The distances between the neighboring plots within
an area were approximately 100 m. A total of 18 plots
were positioned in three HCVFs and two WCs. HCVF3
and WC_Ayam are covered by primary forests, and theother two HCVFs and one WC are covered by old-growth
forest that was harvested during the 1980’s. Four plots in
HCVF1 and two plots in HCVF3 overlap the quadrates
established by Demies and Sang (2008). 11 areas were
set up the eight plots and along the three transects for
the camera trap study. The other four areas were selected
to include the other vegetation types. C06b is a swampy
area where trees were harvested 7 years ago, and C06c
is mostly primary forest remaining along a steep ridge in
coupe 6.
Inside each plot, we measured DBH and heights of all
trees with DBH (at 130 cm above ground) of ≥10 cm. We
painted a red line at the height where DBH was measured
(Figs. 2, 3) and attached a metal number plate (Fig. 4) for
future re-census. All trees were identified by staffs of
Botanical Research Center, Sarawak Forestry Corporation
and Koizumi, referring to the herbarium of Sarawak
Forest Research Center, Kuching (Fig. 5). The classification
followed the Angiosperm Phylogeny Group III system.
There are three formulas for estimating AGB of tropical
moist forest (FAO 1997, Chave et al. 2005):
1) AGB = exp ( -2.977 + ln (ρD 2H ) )
2) AGB = ρ × exp ( -1.499 + 2.148 ln (D ) + 0.207( ln (D ) )2 – 0.0281( ln (D ) )3 )
3) AGB = exp ( -2.134 + 2.53 ln (D ) )
ρ : Wood specific gravity D : Diameter at breast height H : Total tree height
Following these formulas, we obtained three estimates,
AGB1, AGB2, and AGB3, of the AGBs of all
trees. Wood specific gravity data were based on Lemmens
et al. (1995), Oey (1951), Soerianegara and Lemmens
(1993), and Sosef et al. (1998) following Imai et
al. (2012). In case wood specific gravity of a genus was
unknown, we used AGB3 as a substitute for AGB1 and
AGB2 for the tree. As Koizumi did not measure the
tree heights, we calculated only AGB2 and AGB3 for
her data.
Results
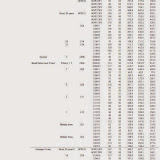
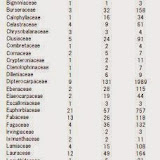
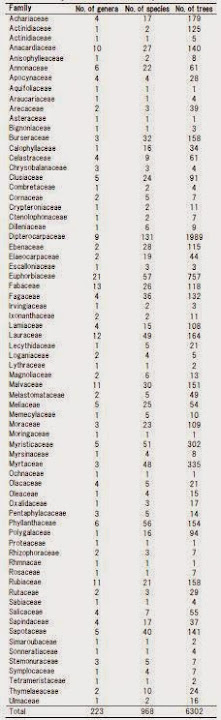
In total, we recorded 6,302 trees in the 70 plots (Table 2), including 968 species of 223 genera and 70 families (Table 3). Dipterocarpaceae was the most dominant family, representing 31.6 % of all trees (1,989 trees and 131 species). HCVFs and WCs had a large stock of AGB (Fig. 6). The mean and standard deviation of AGB2 of all plots were 338.8 ± 197.1 t/ha, whereas those of plots inside HCVFs and WCs were 595.0 ± 157.1. Species richness was not very different between HCVFs and WCs and normal logging areas. The average numbers of species were 137–170 in four plots (approximately 0.5 ha) of HCVFs and WCs and 159–176 in C16, C12, and C11 (Fig. 7).
Discussion
HCVFs and WCs had higher biomass or carbon stock than normal areas that were subjected to logging operations. AGB remained low even 22 or 24 years after the last logging (C16 and C14). Whereas AGB2 in C12, just after harvest, was 227.8 ± 28.0 t/ha, only 280.2 ± 115.6 and 221.2 in C16 and C14, respectively. Although one of the reason of the low biomass stocks in C16 and C14 may be due to the slow speed of biomass recovery under the specific environmental conditions in the two areas (e.g., soil), our results indicated that the biomass of logged-over forests does not recover to the state of unlogged forests during the standard logging cycle of 25 years in ASDU. Thus, HCVFs and WC areas are valuable for showing the original and potential status of standing volume or carbon stock in ASDU. However, the species richness in HCVFs and WCs was not obviously higher than that in normal logging areas. Even areas harvested recently, for example C12 and C11, had many species as HCVFs and WCs. The current logging system is considered not too harmful in reducing the species richness of the original forest. In this study, metal number tags were attached to all enumerated trees. As these metal tags can remain intact for a long time, future surveys such as measuring DBH can be performed and will allow the determination the growth rate of these trees. Among potential uses of such information is the calculation of annual growing speed, which in turn can be used to revise the annual allowable cutting volume for sustainable timber production. The presence of the primary forests in HCVFs and WCs inside ASDU is of high advantage for the management of FMU, given that few existing FMUs in Sarawak retain such original habitats to show the original forest conditions inside FMU. Acknowledgements
We thank the staff of Sarawak Forestry Corporation, Rantai Jawa, Tinjan Kuda, and Shalih bin Rebi, who helped in conducting the fieldwork and the identification of tree species. We also thank the managing director of Zedtee Sdn Bhd, Wong Ing Yong; his staff, John Tasan and Wong Toh Meo; and the other staff in Sekawie Camp and Ayam Camp for their support during the field work. We also thank our local assistants who helped in our field work. We thank Jason Hon, WWF Malaysia, who introduced us to ASDU, helped conduct this study, and also edited this report. This study was financially supported by a Grant-in-Aid for Scientific Research (S) 22221010 from the Japan Society for the Promotion of Sciences and permitted by Forest Department of Sarawak (NCCD.907.4.4 (Jld.7) -67).
References
Chave, J., C. Andalo, S. Brown, M. A. Cairns, J. Q. Chambers, D. Eamus, H. Fölster, F. Fromard, N. Higuchi, T. Kira, J.-P. Lescure, B. W. Nelson, H. Ogawa, H. Puig, B. Riera, and T. Yamakura. 2005. Tree allometry and improved estimation of carbon stocks and balance in tropical forests. Oecologia 145:87-99. Demies, M. and J. Sang. 2008. Structure and Species Composition of Three Dipterocarp Genera in Anap Muput High Conservation Value Forests. Sarawak Forestry Corporation. FAO. 1997. Estimating Biomass and Biomass Change of Tropical Forests: a Primer. Hon, J. 2013 Importance of salt licks and roles of production forests for the conservation of wildlife in central Sarawak, Malaysian Borneo. PhD Dissertation, Kyoto University, Japan Hon, J. 2011. A new record for the Borneo bay cat in central Sarawak, Malaysian Borneo. Cat News 55:4-6. Hon, J. and S. Shibata. 2013. Temporal Partitioning by Animals Visiting Salt Licks. International Journal of Environmental Science and Development:44-48. Koizumi, M. 2012. Developing a plant-survey method at Anap-Muput Forest Management Unit. Equatorial Biomass Society 3:4-5. Samejima, H. and J. Hon. 2014. Ground-dwelling Mammals and Birds recorded by camera traps in logged over forest in Anap Sustainable Development Unit, Sarawak, Malaysia. Equatorial Biomass Society 10: 1-6 Notes
1:E-mail: lahang.lejau@gmail.com
Malcom Demies(Sarawak Forestry Cooperation)
Miyako Koizumi(Graduate School of Agriculture, Kyoto University)
Introduction
Maintenance of biomass or carbon stock and biodiversity are among the targets of sustainable forest management (SFM) and establishing a high conservation value forest (HCVF) is one of the measures of SFM to achieve these targets. However, the performance of HCVF management has not been well studied. Inside the Anap Sustainable Development Unit (ASDU), Sarawak, Malaysia, four HCVFs and three water catchment areas (WCs) have been established. WCs in ASDU were originally listed as a part of HCVFs in the Forest Management Plan for Anap-Muput Year 2006–2025, and accordingly can be considered part of HCVFs in ASDU. In ASDU, we established 70 vegetation plots to evaluate the aboveground biomass (AGB) and tree species diversity in the management area. Using these data, we evaluated the contribution of HCVFs in sustaining the high biomass and rich biodiversity of ASDU. Materials and Methods
Study site
ASDU is located in Tatau District, Bintulu Division, Sarawak, Malaysia. It is managed by a private company, Zedtee Sdn Bhd. ASDU covers an area of 106,820 ha, and its forests can be classified into three types: lowland/hill mixed dipterocarp forest (MDF), Kerangas forest, and riparian forest. MDF is the major forest type in lowland Borneo and ASDU. Kerangas forest is a heath forest on sandy nutrient-poor soil, distributed in the southeast part of ASDU. Riparian forest is a type of MDF distributed along rivers but generally more degraded and with lower densities of large trees than normal MDF on the slopes and ridges, probably because the riparian area is more vulnerable to logging disturbance. The management system of ASDU is divided into three parts: Anap-Muput Forest Management Unit (FMU: T/4317), which forms the main part; an area with License for Planted Forest (LPF/0039) in the northern part; and Anap-Belawit state land in the south (Fig. 1). The Anap- Muput FMU is divided into coupes and managed in a 25- year cutting cycle for sustainable timber production of indigenous tree species such as meranti (Shorea spp.) and kapur (Dryobalanops spp.). Logging activity in ASDU started in 1977, all the coupes have been harvested at least once, and coupes 1–12 have been harvested again in the last 12 years. LPF is allocated for intensive planting of fast-growing species, and the original vegetation has been repeatedly harvested, but most of the area has not been planted to date.
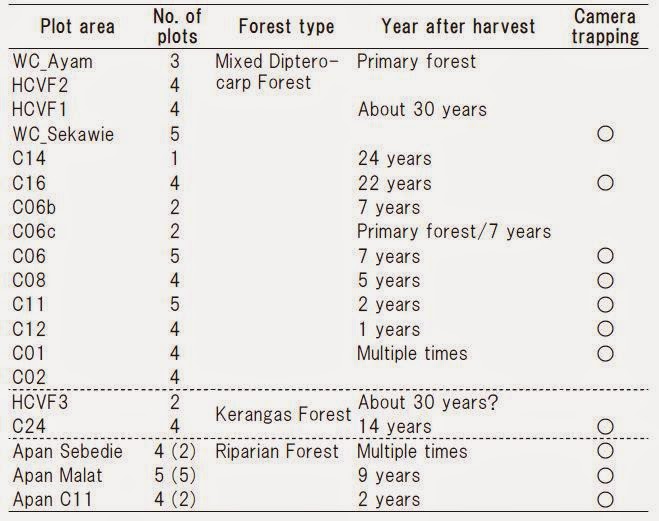
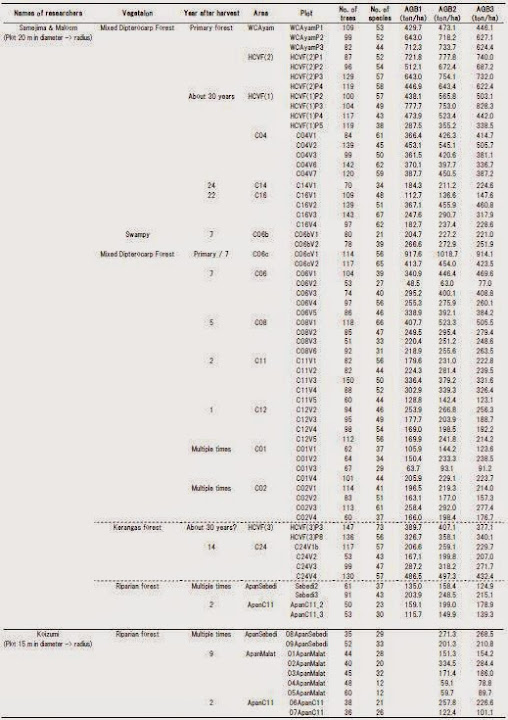
Table 1: List of plots. Numbers in parentheses show numbers of plots established by Koizumi.
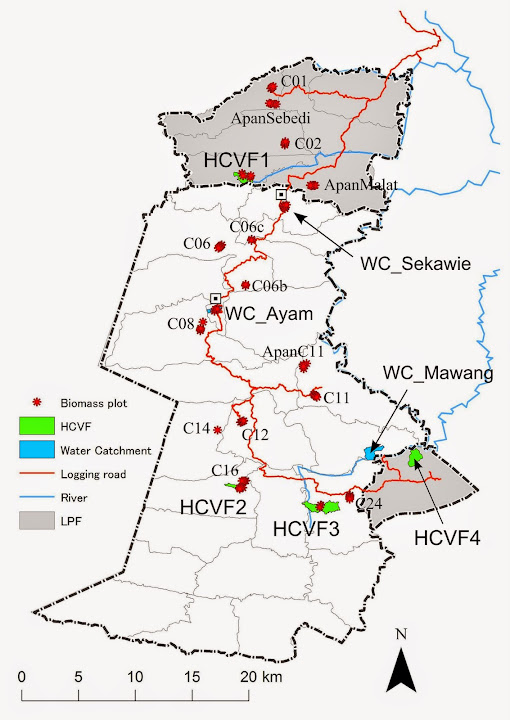
Figure 1: Locations of plot areas.

 In ASDU, H. Samejima and J. Hon established eight
plots to conduct camera-trapping surveys for grounddwelling,
middle, and large-sized mammals from 2011
to 2013 (Samejima & Hon 2014). One plot is a circle with
1-km diameter and eight cameras are set inside at randomly
selected points. Hon also established a 2-km line
transect along each of the three rivers where natural salt
licks were present and conducted a camera trap survey
from 2010 to 2011 (Hon 2011; 2013; Hon & Shibata 2013).
In ASDU, Zedtee established four HCVFs, HCVF1–4.
Demies and Sang (2008) established six quadrats in
HCVF1, three in HCVF2, nine in HCVF3, and five in
HCVF4 in 2008. Each quadrat was of 50 × 50 m. They
recorded all trees belonging to three genera of Dipterocarpaceae,
Dipterocarpus, Dryobalanops, and Shorea with
diameter at breast height (DBH) of ≥10 cm.
Vegetation plots
From 2011 to 2013, H. Samejima and M. Demies established
61 circle plots with radius 20 m (0.126 ha) and M.
Koizumi established 9 circle plots with radius 15 m (0.071
ha) distributed in 19 areas (Table 1, Fig. 1, Koizumi
2012). The distances between the neighboring plots within
an area were approximately 100 m. A total of 18 plots
were positioned in three HCVFs and two WCs. HCVF3
and WC_Ayam are covered by primary forests, and theother two HCVFs and one WC are covered by old-growth
forest that was harvested during the 1980’s. Four plots in
HCVF1 and two plots in HCVF3 overlap the quadrates
established by Demies and Sang (2008). 11 areas were
set up the eight plots and along the three transects for
the camera trap study. The other four areas were selected
to include the other vegetation types. C06b is a swampy
area where trees were harvested 7 years ago, and C06c
is mostly primary forest remaining along a steep ridge in
coupe 6.
Inside each plot, we measured DBH and heights of all
trees with DBH (at 130 cm above ground) of ≥10 cm. We
painted a red line at the height where DBH was measured
(Figs. 2, 3) and attached a metal number plate (Fig. 4) for
future re-census. All trees were identified by staffs of
Botanical Research Center, Sarawak Forestry Corporation
and Koizumi, referring to the herbarium of Sarawak
Forest Research Center, Kuching (Fig. 5). The classification
followed the Angiosperm Phylogeny Group III system.
There are three formulas for estimating AGB of tropical
moist forest (FAO 1997, Chave et al. 2005):
1) AGB = exp ( -2.977 + ln (ρD 2H ) )
2) AGB = ρ × exp ( -1.499 + 2.148 ln (D ) + 0.207( ln (D ) )2 – 0.0281( ln (D ) )3 )
3) AGB = exp ( -2.134 + 2.53 ln (D ) )
ρ : Wood specific gravity D : Diameter at breast height H : Total tree height
Following these formulas, we obtained three estimates,
AGB1, AGB2, and AGB3, of the AGBs of all
trees. Wood specific gravity data were based on Lemmens
et al. (1995), Oey (1951), Soerianegara and Lemmens
(1993), and Sosef et al. (1998) following Imai et
al. (2012). In case wood specific gravity of a genus was
unknown, we used AGB3 as a substitute for AGB1 and
AGB2 for the tree. As Koizumi did not measure the
tree heights, we calculated only AGB2 and AGB3 for
her data.
Results
In ASDU, H. Samejima and J. Hon established eight
plots to conduct camera-trapping surveys for grounddwelling,
middle, and large-sized mammals from 2011
to 2013 (Samejima & Hon 2014). One plot is a circle with
1-km diameter and eight cameras are set inside at randomly
selected points. Hon also established a 2-km line
transect along each of the three rivers where natural salt
licks were present and conducted a camera trap survey
from 2010 to 2011 (Hon 2011; 2013; Hon & Shibata 2013).
In ASDU, Zedtee established four HCVFs, HCVF1–4.
Demies and Sang (2008) established six quadrats in
HCVF1, three in HCVF2, nine in HCVF3, and five in
HCVF4 in 2008. Each quadrat was of 50 × 50 m. They
recorded all trees belonging to three genera of Dipterocarpaceae,
Dipterocarpus, Dryobalanops, and Shorea with
diameter at breast height (DBH) of ≥10 cm.
Vegetation plots
From 2011 to 2013, H. Samejima and M. Demies established
61 circle plots with radius 20 m (0.126 ha) and M.
Koizumi established 9 circle plots with radius 15 m (0.071
ha) distributed in 19 areas (Table 1, Fig. 1, Koizumi
2012). The distances between the neighboring plots within
an area were approximately 100 m. A total of 18 plots
were positioned in three HCVFs and two WCs. HCVF3
and WC_Ayam are covered by primary forests, and theother two HCVFs and one WC are covered by old-growth
forest that was harvested during the 1980’s. Four plots in
HCVF1 and two plots in HCVF3 overlap the quadrates
established by Demies and Sang (2008). 11 areas were
set up the eight plots and along the three transects for
the camera trap study. The other four areas were selected
to include the other vegetation types. C06b is a swampy
area where trees were harvested 7 years ago, and C06c
is mostly primary forest remaining along a steep ridge in
coupe 6.
Inside each plot, we measured DBH and heights of all
trees with DBH (at 130 cm above ground) of ≥10 cm. We
painted a red line at the height where DBH was measured
(Figs. 2, 3) and attached a metal number plate (Fig. 4) for
future re-census. All trees were identified by staffs of
Botanical Research Center, Sarawak Forestry Corporation
and Koizumi, referring to the herbarium of Sarawak
Forest Research Center, Kuching (Fig. 5). The classification
followed the Angiosperm Phylogeny Group III system.
There are three formulas for estimating AGB of tropical
moist forest (FAO 1997, Chave et al. 2005):
1) AGB = exp ( -2.977 + ln (ρD 2H ) )
2) AGB = ρ × exp ( -1.499 + 2.148 ln (D ) + 0.207( ln (D ) )2 – 0.0281( ln (D ) )3 )
3) AGB = exp ( -2.134 + 2.53 ln (D ) )
ρ : Wood specific gravity D : Diameter at breast height H : Total tree height
Following these formulas, we obtained three estimates,
AGB1, AGB2, and AGB3, of the AGBs of all
trees. Wood specific gravity data were based on Lemmens
et al. (1995), Oey (1951), Soerianegara and Lemmens
(1993), and Sosef et al. (1998) following Imai et
al. (2012). In case wood specific gravity of a genus was
unknown, we used AGB3 as a substitute for AGB1 and
AGB2 for the tree. As Koizumi did not measure the
tree heights, we calculated only AGB2 and AGB3 for
her data.
ResultsIn total, we recorded 6,302 trees in the 70 plots (Table 2), including 968 species of 223 genera and 70 families (Table 3). Dipterocarpaceae was the most dominant family, representing 31.6 % of all trees (1,989 trees and 131 species). HCVFs and WCs had a large stock of AGB (Fig. 6). The mean and standard deviation of AGB2 of all plots were 338.8 ± 197.1 t/ha, whereas those of plots inside HCVFs and WCs were 595.0 ± 157.1. Species richness was not very different between HCVFs and WCs and normal logging areas. The average numbers of species were 137–170 in four plots (approximately 0.5 ha) of HCVFs and WCs and 159–176 in C16, C12, and C11 (Fig. 7).
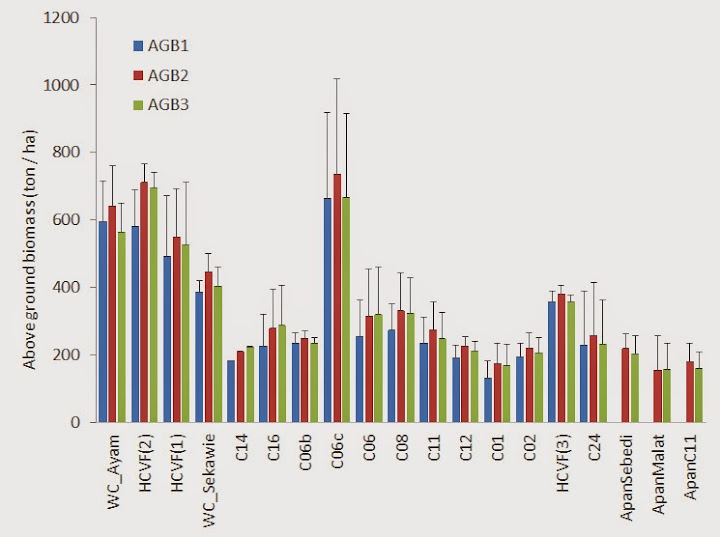
Figure 6: Estimated above ground biomass of 19 areas.
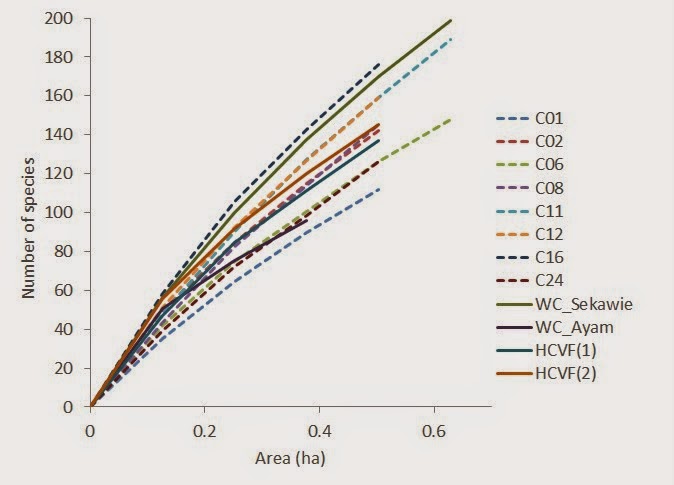
Figure 7: Species rarefaction curve with number of species against total area (hectare) of plots for 12 areas where more than three 20-m radius vegetation plots wereestablished. The number of species are average number of number of species in 1000 times randomly selected plots in each area.
HCVFs and WCs had higher biomass or carbon stock than normal areas that were subjected to logging operations. AGB remained low even 22 or 24 years after the last logging (C16 and C14). Whereas AGB2 in C12, just after harvest, was 227.8 ± 28.0 t/ha, only 280.2 ± 115.6 and 221.2 in C16 and C14, respectively. Although one of the reason of the low biomass stocks in C16 and C14 may be due to the slow speed of biomass recovery under the specific environmental conditions in the two areas (e.g., soil), our results indicated that the biomass of logged-over forests does not recover to the state of unlogged forests during the standard logging cycle of 25 years in ASDU. Thus, HCVFs and WC areas are valuable for showing the original and potential status of standing volume or carbon stock in ASDU. However, the species richness in HCVFs and WCs was not obviously higher than that in normal logging areas. Even areas harvested recently, for example C12 and C11, had many species as HCVFs and WCs. The current logging system is considered not too harmful in reducing the species richness of the original forest. In this study, metal number tags were attached to all enumerated trees. As these metal tags can remain intact for a long time, future surveys such as measuring DBH can be performed and will allow the determination the growth rate of these trees. Among potential uses of such information is the calculation of annual growing speed, which in turn can be used to revise the annual allowable cutting volume for sustainable timber production. The presence of the primary forests in HCVFs and WCs inside ASDU is of high advantage for the management of FMU, given that few existing FMUs in Sarawak retain such original habitats to show the original forest conditions inside FMU. Acknowledgements
We thank the staff of Sarawak Forestry Corporation, Rantai Jawa, Tinjan Kuda, and Shalih bin Rebi, who helped in conducting the fieldwork and the identification of tree species. We also thank the managing director of Zedtee Sdn Bhd, Wong Ing Yong; his staff, John Tasan and Wong Toh Meo; and the other staff in Sekawie Camp and Ayam Camp for their support during the field work. We also thank our local assistants who helped in our field work. We thank Jason Hon, WWF Malaysia, who introduced us to ASDU, helped conduct this study, and also edited this report. This study was financially supported by a Grant-in-Aid for Scientific Research (S) 22221010 from the Japan Society for the Promotion of Sciences and permitted by Forest Department of Sarawak (NCCD.907.4.4 (Jld.7) -67).
References
Chave, J., C. Andalo, S. Brown, M. A. Cairns, J. Q. Chambers, D. Eamus, H. Fölster, F. Fromard, N. Higuchi, T. Kira, J.-P. Lescure, B. W. Nelson, H. Ogawa, H. Puig, B. Riera, and T. Yamakura. 2005. Tree allometry and improved estimation of carbon stocks and balance in tropical forests. Oecologia 145:87-99. Demies, M. and J. Sang. 2008. Structure and Species Composition of Three Dipterocarp Genera in Anap Muput High Conservation Value Forests. Sarawak Forestry Corporation. FAO. 1997. Estimating Biomass and Biomass Change of Tropical Forests: a Primer. Hon, J. 2013 Importance of salt licks and roles of production forests for the conservation of wildlife in central Sarawak, Malaysian Borneo. PhD Dissertation, Kyoto University, Japan Hon, J. 2011. A new record for the Borneo bay cat in central Sarawak, Malaysian Borneo. Cat News 55:4-6. Hon, J. and S. Shibata. 2013. Temporal Partitioning by Animals Visiting Salt Licks. International Journal of Environmental Science and Development:44-48. Koizumi, M. 2012. Developing a plant-survey method at Anap-Muput Forest Management Unit. Equatorial Biomass Society 3:4-5. Samejima, H. and J. Hon. 2014. Ground-dwelling Mammals and Birds recorded by camera traps in logged over forest in Anap Sustainable Development Unit, Sarawak, Malaysia. Equatorial Biomass Society 10: 1-6 Notes
1:E-mail: lahang.lejau@gmail.com